【GIS效果:立体多边形】使用js绘制阴影多边形
已被阅读 8183 次 | 文章分类:gis随笔 | 2022-03-07 00:17
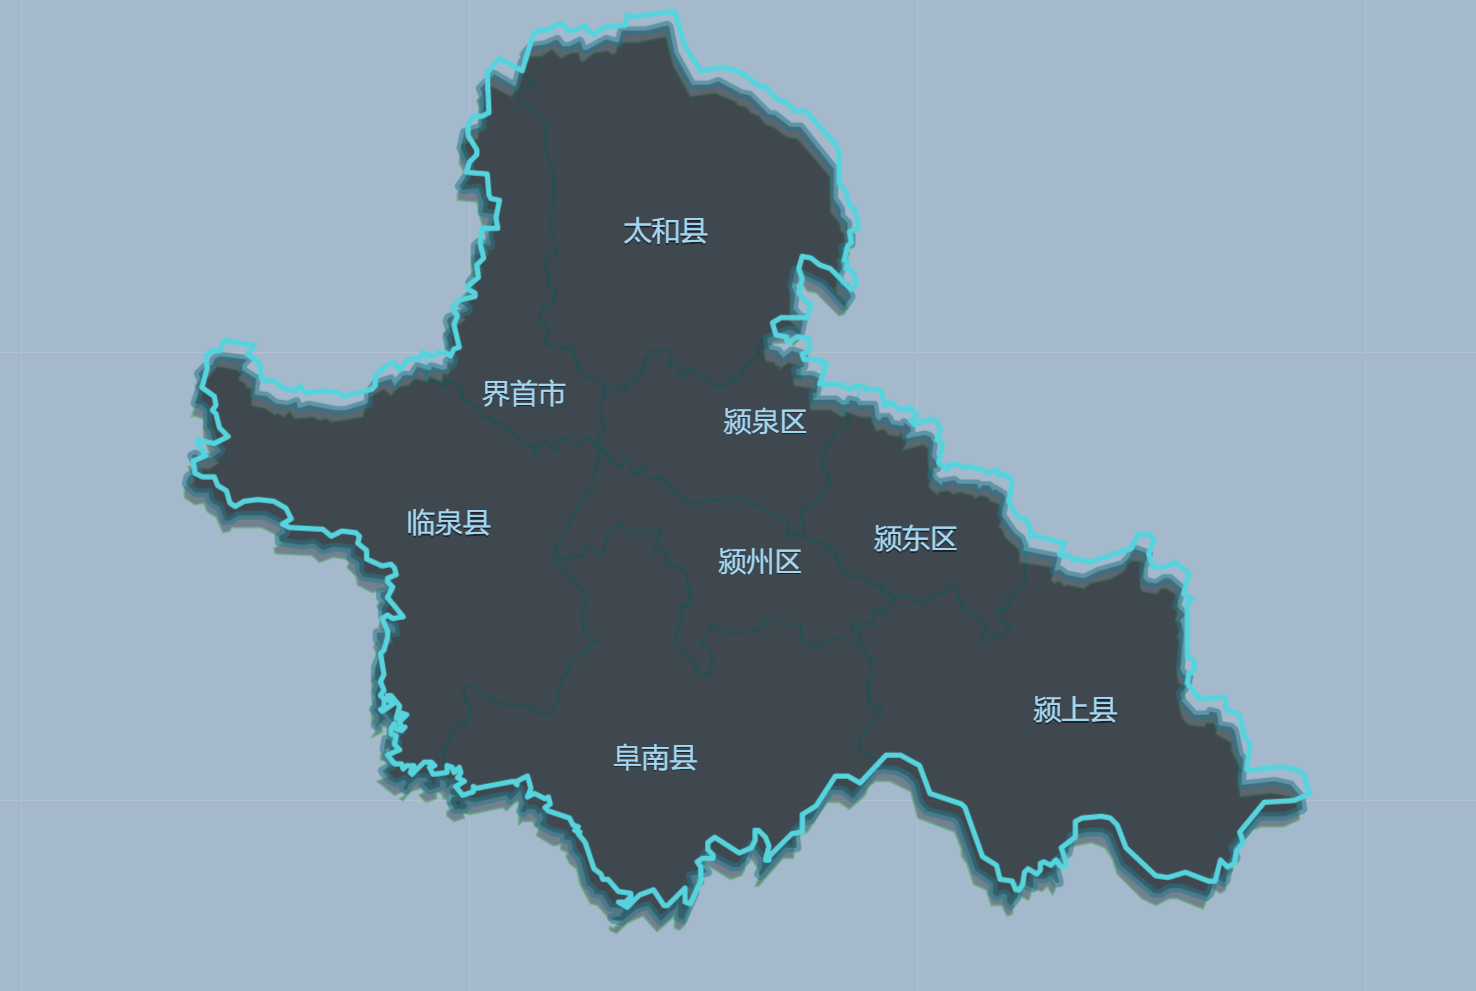
流行的地图api没有实现 矢量数据的立体效果,通过本文代码可以实现如下效果;本文采用天地图api;当然openlayers arcgis api for javascript等都可以实现的😀
1 实现效果
绘制如下的矢量多边形效果;
2 实现技术
(1) 首先用ajax请求geojson文件,从文件解析并获取到坐标数据
下面这个方法就是解析geojson返回的featurecollection中的坐标方式;其中可能有多段线稍微处理一下即可
/**
 * 从featureCollection获取所有linestring
 * @param {*} featureCollection
 * @returns  返回线段数组
 */
function  getLinesFromGeojson(featureCollection){
    let lines=[];
    let geometries=featureCollection.geometries
    for(let i=0;i<geometries.length;i++){
        let geometry=geometries[i]
        let type=geometry.type;
        if(type==="LineString"){
            let line=geometry.coordinates
            lines.push(line)
        }
        if(type==="MultiLineString"){
            let subLines=geometry.coordinates
           lines=lines.concat(subLines)
        }
    }
    return lines
}