openlayers实现流动箭头样式的路线
已被阅读 10073 次 | 文章分类:OpenLayers | 2021-06-22 23:35
前面文章实现过给线段实现等间距添加点样式,本文使用openlayers实现箭头样式,原理一样,但是箭头多了方向性问题,所以需要计算一个旋转角度的问题;
1 其他效果
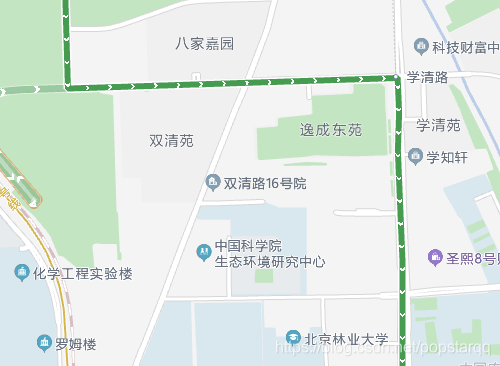
在使用百度地图或者高德地图导航的时候,会看到如下效果
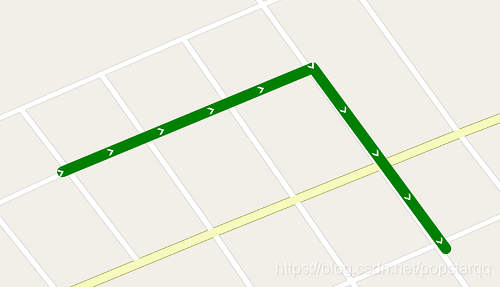
本文实现的流动效果如下
2 箭头添加过程
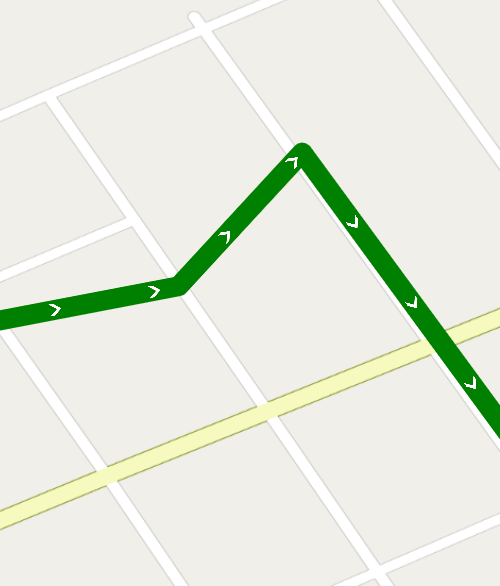
首先准备一个箭头图标,作为图标样式;然后根据箭头位置以及所处的线段计算出箭头跟路线方向一样的方向角,计算过程如下
// 添加箭头样式
   for (var i = 0; i <= 1; i += radio) {
      let fracPos =i+offset
      if(fracPos>1) fracPos-=1;
       var arrowLocation = geometry.getCoordinateAt(fracPos);
       geometry.forEachSegment(function (start, end) {
           var dx1 = end[0] - arrowLocation[0];
           var dy1 = end[1] - arrowLocation[1];
           var dx2 = arrowLocation[0] - start[0];
           var dy2 = arrowLocation[1] - start[1];
           if (dx1 != dx2 && dy1 != dy2) {
             if (Math.abs(dradio * dx1 * dy2 - dradio * dx2 * dy1) < 0.001) {
               var dx = end[0] - start[0];
               var dy = end[1] - start[1];
               var rotation = Math.atan2(dy, dx);   // 得到箭头方向角
               styles.push(
                 new Style.Style({
                   geometry: new Point(arrowLocation),
                   image: new Style.Icon({
                     src: '../static/imgs/arrow-white.png',
                     anchor: [0.75, 0.5],
                     scale:0.15,
                     rotateWithView: false,
                     color:'white',
                     rotation: -rotation
                   })
                 })
               );
             }
           }
     });
   }
全部代码
/**
 * 完整可用
 */
 import { Map, View, Feature } from 'ol';
 import * as Style from 'ol/style';
 import { OSM as OsmSource } from 'ol/source';
 import { Tile as TileLayer, Vector as VectorLayer } from 'ol/layer';
 import { Vector as VectorSource } from 'ol/source';
 import {
     Point,
     LineString
   } from 'ol/geom';
 import 'ol/ol.css';
 let map = new Map({
   target: 'map',
   layers: [
     new TileLayer({
       source: new OsmSource()
     })
   ],
   view: new View({
     center: [99.64149080182347, 39.57246995882144],
     zoom: 18,
     projection: 'EPSG:4326'
   })
 });

 /**
  * 创建线 linestiring
  */
  var layer = new VectorLayer({})
  var source = new VectorSource();
  layer.setSource(source);
  map.addLayer(layer);
  var feature;
  let arr=[
   [99.64064006712545, 39.57211613643938],
   [99.64149080182347, 39.57246995882144],
   [99.64311537333242, 39.573145621589674],
   [99.64381486128156, 39.572191381856385],
   [99.64442816904665, 39.571354708917454]
 ];
 feature = new Feature({
  geometry: new LineString(arr)
});
source.addFeature(feature);
 var stylesFunction=function () {
   let resolution=map.getView().getResolution(); //分辨率:一个像素代表的距离
   var geometry =  feature.getGeometry(); //几何对象:空间坐标信息等
   var length = geometry.getLength(); //长度:线几何对象的长度
   var radio = (100 * resolution) / length; //间隔分之一 分割了多少段
   var dradio = 100000000; //投影坐标系,如3857等,在EPSG:4326下可以设置dradio=10000
   // 线段样式
   var styles = [
     new Style.Style({
       stroke: new Style.Stroke({
         color: "green",
         width: 20,
       })
     })
   ];

   // 添加箭头样式
   for (var i = 0; i <= 1; i += radio) {
       var arrowLocation = geometry.getCoordinateAt(i);
       geometry.forEachSegment(function (start, end) {
           // 暂时不考虑这种情况
           // if (start[0] == end[0] || start[1] == end[1]) return;
           var dx1 = end[0] - arrowLocation[0];
           var dy1 = end[1] - arrowLocation[1];
           var dx2 = arrowLocation[0] - start[0];
           var dy2 = arrowLocation[1] - start[1];
           if (dx1 != dx2 && dy1 != dy2) {
             if (Math.abs(dradio * dx1 * dy2 - dradio * dx2 * dy1) < 0.001) {
               var dx = end[0] - start[0];
               var dy = end[1] - start[1];
               var rotation = Math.atan2(dy, dx);  // 得到箭头方向角
               styles.push(
                 new Style.Style({
                   geometry: new Point(arrowLocation),
                   image: new Style.Icon({
                     src: '../static/imgs/arrow-white.png',
                     anchor: [0.75, 0.5],
                     scale:0.15,
                     rotateWithView: false,
                     color:'white',
                     rotation: -rotation

                   })
                 })
               );
             }
           }
     });
   }
   return styles;
  }


feature.setStyle(stylesFunction);