ArcGiS Api For JavaScript之绘制点Graphic
已被阅读 3116 次 | 文章分类:ArcGIS API For Javascript | 2018-03-07 00:46
一副地图有很多图层组成,图层包括点图层,线图层,面图层,在WebGIS开发中生成点线面是经常要用到的基本功能,该文章以绘制点Graphic为例介绍绘制的基本原理;
一:绘制原理
利用ArcGIS API绘制的Graphic有四个基本属性:几何、符号、属性、信息模板; 几何:点要素的基本空间信息,如经纬度坐标; 符号:点要素显示的样式; 属性:点拥有的属性信息,如一个电线杆的长度,直径等信息; 信息模板:通过点击点要素可以弹窗展示属性信息;
二:代码实例
<!DOCTYPE html>
<html>
<head>
<meta http-equiv="Content-Type" content="text/html; charset=utf-8">
<meta name="viewport" content="initial-scale=1, maximum-scale=1, user-scalable=no">
<title>Graphic_Point</title>
<link rel="stylesheet" href="https://js.arcgis.com/3.23/esri/css/esri.css">
<style>
html, body, #map {
height: 100%;
width: 100%;
margin: 0;
padding: 0;
}
</style>
<script src="https://js.arcgis.com/3.23/"></script>
<script>
var map;
require([
"esri/map",
"esri/SpatialReference",
"esri/symbols/TextSymbol",
"esri/Color",
"esri/geometry/Point",
"esri/symbols/SimpleMarkerSymbol",
"esri/InfoTemplate",
"esri/graphic",
"esri/layers/GraphicsLayer",
"dojo/domReady!"
], function (
Map,
SpatialReference,
TextSymbol,
Color,
Point,
SimpleMarkerSymbol,
InfoTemplate,
Graphic,
GraphicsLayer)
{
var sr= new SpatialReference({ "wkid": 4326 });
// 定义map实例对象
map = new Map("map", {
center:[116.423816,39.909401],
basemap:"topo"
});
//定义点Graphic对象
var pt = new Point(116.423816, 39.909401, sr)
var sms = new SimpleMarkerSymbol().setStyle(SimpleMarkerSymbol.STYLE_DIAMOND).setColor(new Color([255, 0, 0, 0.5]));
var attr = { "Xcoord": 116.423816, "Ycoord": 39.909401, "Name": "BeiJing" };
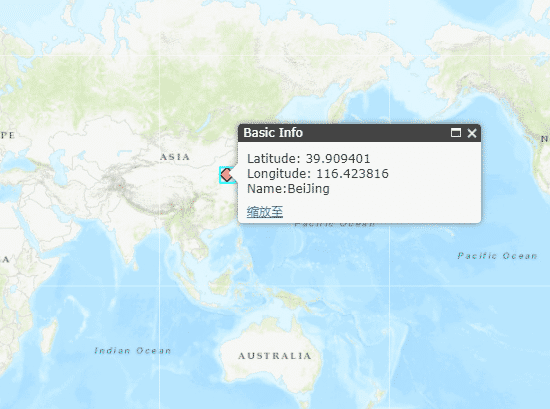
var infoTemplate = new InfoTemplate("Basic Info", "Latitude: ${Ycoord} <br/> Longitude: ${Xcoord} <br/>Name:${Name}");
var graphic = new Graphic(pt, sms, attr, infoTemplate);
//定义点的标注对象
var Labelsymbol = new TextSymbol("北京").setColor(new Color("#ff0d08"));
Labelsymbol.font.setSize("11pt");
Labelsymbol.font.setFamily("KaiTi");
Labelsymbol.setOffset(30, 0)
var ptlabelgraphic = new Graphic(pt, Labelsymbol);
//定义存放Graphic的图层对象
var ptgraphLayer = new GraphicsLayer();
var ptlabelLayer = new GraphicsLayer();
//添加Graphic对象和标注对象到对应的GraphicsLayer
ptgraphLayer.add(graphic);
ptlabelLayer.add(ptlabelgraphic);
//添加图层对象到地图中
map.addLayers([ptgraphLayer, ptlabelLayer]);
});
</script>
</head>
<body>
<div id="map"></div>
</body>
</html>
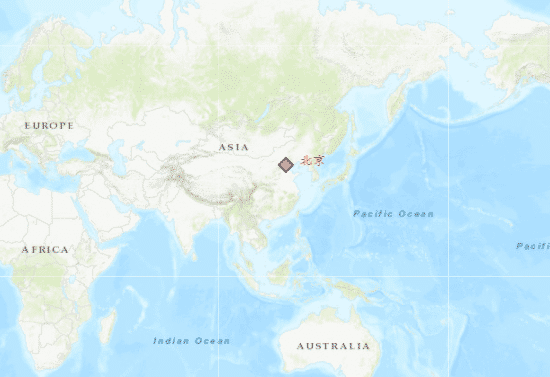
三:运行效果