leaflet入门教程(六):Geojson方法 options的用法
已被阅读 4433 次 | 文章分类:leafLet | 2018-10-14 17:04
本节介绍L.geoJson()方法的第二个参数,options中各种属性的应用,可以使几何图形更具有可定制性和动态性
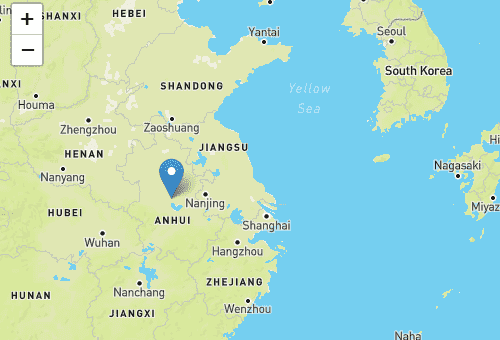
一:绘制点
1.一个GeoJson对象有三个基本属性type、properties、geometry,而且properties中可以自定义任意的属性
var geojsonFeature_point ={
    "type": "Feature",
    "properties": {
        "name": "Coors Field",
        "amenity": "Baseball Stadium",
        "popupContent": "this is a point By Geojson"
    },
    "geometry": {
        "type": "Point",
        "coordinates": [117.2882028929, 31.864942016]
    }
};
L.geoJSON(geojsonFeature_point).bindPopup(geojsonFeature_point.properties.popupContent).addTo(map);
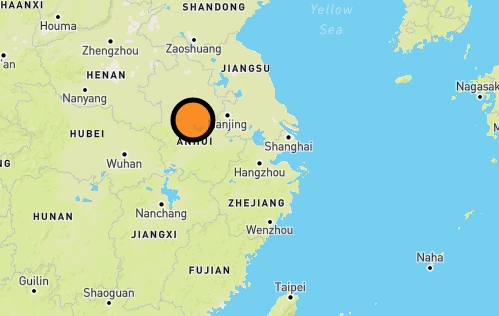
2.自定义点样式 设置pointToLayer属性,可以重新设置点样式
//pointToLayer 可以重新定义点的样式
var geojsonMarkerOptions = {
    radius: 8,
    fillColor: "#ff7800",
    color: "#000",
    weight: 1,
    opacity: 1,
    fillOpacity: 0.8
};
L.geoJSON(geojsonFeature,{
    pointToLayer: function (feature, latlng) {
        return L.circleMarker(latlng, geojsonMarkerOptions);
    }
}).addTo(map);
3.效果图
二:通过style属性,定义图形样式
1.以属性的方式改变样式
//简写的feature对象,默认为geometry对象
var myLines ={
    'type':'GeometryCollection',
    'geometries':
        [{
        "type": "LineString",
        "coordinates": [[116.2882028929, 31.864942016], [115.2882028929, 35.864942016], [117.2882028929, 31.864942016]]
        }, {
            "type": "LineString",
            "coordinates": [[117.2882028929, 29.864942016], [112.2882028929, 22.864942016], [117.2882028929, 21.864942016]]
        }]
} ;
//属性定义样式
var myStyle = {
    "color": "#ff7800",
    "weight": 25,
    "opacity": 1
};
L.geoJSON(myLines,{style:myStyle}).addTo(map);
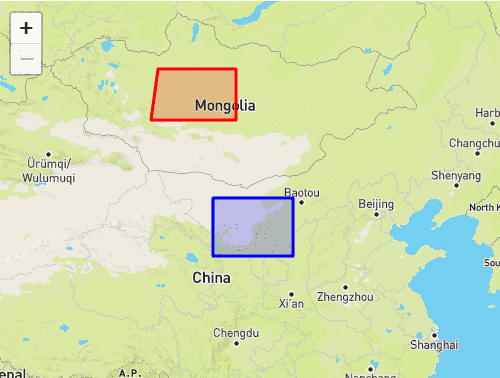
2.定义一个函数,返回特定样式
//style 函数定义样式
var states = [{
    "type": "Feature",
    "properties": {"party": "Republican"},
    "geometry": {
        "type": "Polygon",
        "coordinates": [[
            [104.05, 48.99],
            [97.22,  48.98],
            [96.58,  45.94],
            [104.03, 45.94],
            [104.05, 48.99]
        ]]
    }
}, {
    "type": "Feature",
    "properties": {"party": "Democrat"},
    "geometry": {
        "type": "Polygon",
        "coordinates": [[
            [109.05, 41.00],
            [102.06, 40.99],
            [102.03, 36.99],
            [109.04, 36.99],
            [109.05, 41.00]
        ]]
    }
}];
L.geoJSON(states, {
    style: function(feature) {
        switch (feature.properties.party) {
            case 'Republican': return {color: "#ff0000"};
            case 'Democrat':   return {color: "#0000ff"};
        }
    }
}).addTo(map);
3.效果图
三:filter属性
1.filter属性通过一个函数去设置,通过返回的true或false值去显示或者隐藏几何图形,定义一个函数,返回特定样式
var geojsonFeature_fitler =[{
    "type": "Feature",
    "properties": {
        "name": "Coors Field",
        "show_on_map": true
    },
    "geometry": {
        "type": "Point",
        "coordinates": [94.99404, 39.85621]
    }
}, {
    "type": "Feature",
    "properties": {
        "name": "Busch Field",
        "show_on_map": false
    },
    "geometry": {
        "type": "Point",
        "coordinates": [94.98404, 39.74621]
    }
}];
L.geoJSON(geojsonFeature_fitler, {
    filter: function(feature, layer) {
        return feature.properties.show_on_map;
    }
}).addTo(map);